
How to Build an AI SRE Agent in 2026: A Step-by-Step Tutorial with LangGraph, MCP and Temporal
Build an AI SRE agent that investigates Kubernetes alerts: LangGraph, MCP tools, Temporal and Slack approval, with reference code and 4 architecture diagrams.
Last updated: 21 September 2026. The code in this post is reference code written against LangChain 1.4.2, LangGraph 1.2.11, langchain-mcp-adapters 0.3.2, temporalio 1.33.0 and nbctl 0.0.3. Pin those versions, or check the linked docs if you are on newer releases.
Quick answer: An AI SRE agent is five parts wired together: a trigger (an alert), a reasoning loop (an LLM agent), read-only tools that fetch evidence (Kubernetes, metrics, logs), a durable workflow that survives failures and waits for people, and a human approval step. In this tutorial you build one with Prometheus Alertmanager, LangChain's create_agent on the LangGraph runtime, MCP tools, Temporal and Slack.
What is an AI SRE agent?
An AI SRE agent is software that does the first part of an incident investigation for you. When an alert fires, it reads the alert, queries the cluster, metrics and logs, forms hypotheses about the cause, checks them against evidence, and returns a root cause with a proposed fix. The useful ones cite every piece of evidence, so the on-call engineer can check the reasoning in a minute instead of repeating the investigation.
If you would rather buy than build, we compared the 15 AI SRE tools on the market. This post is for teams who want to understand the moving parts, or build their own.
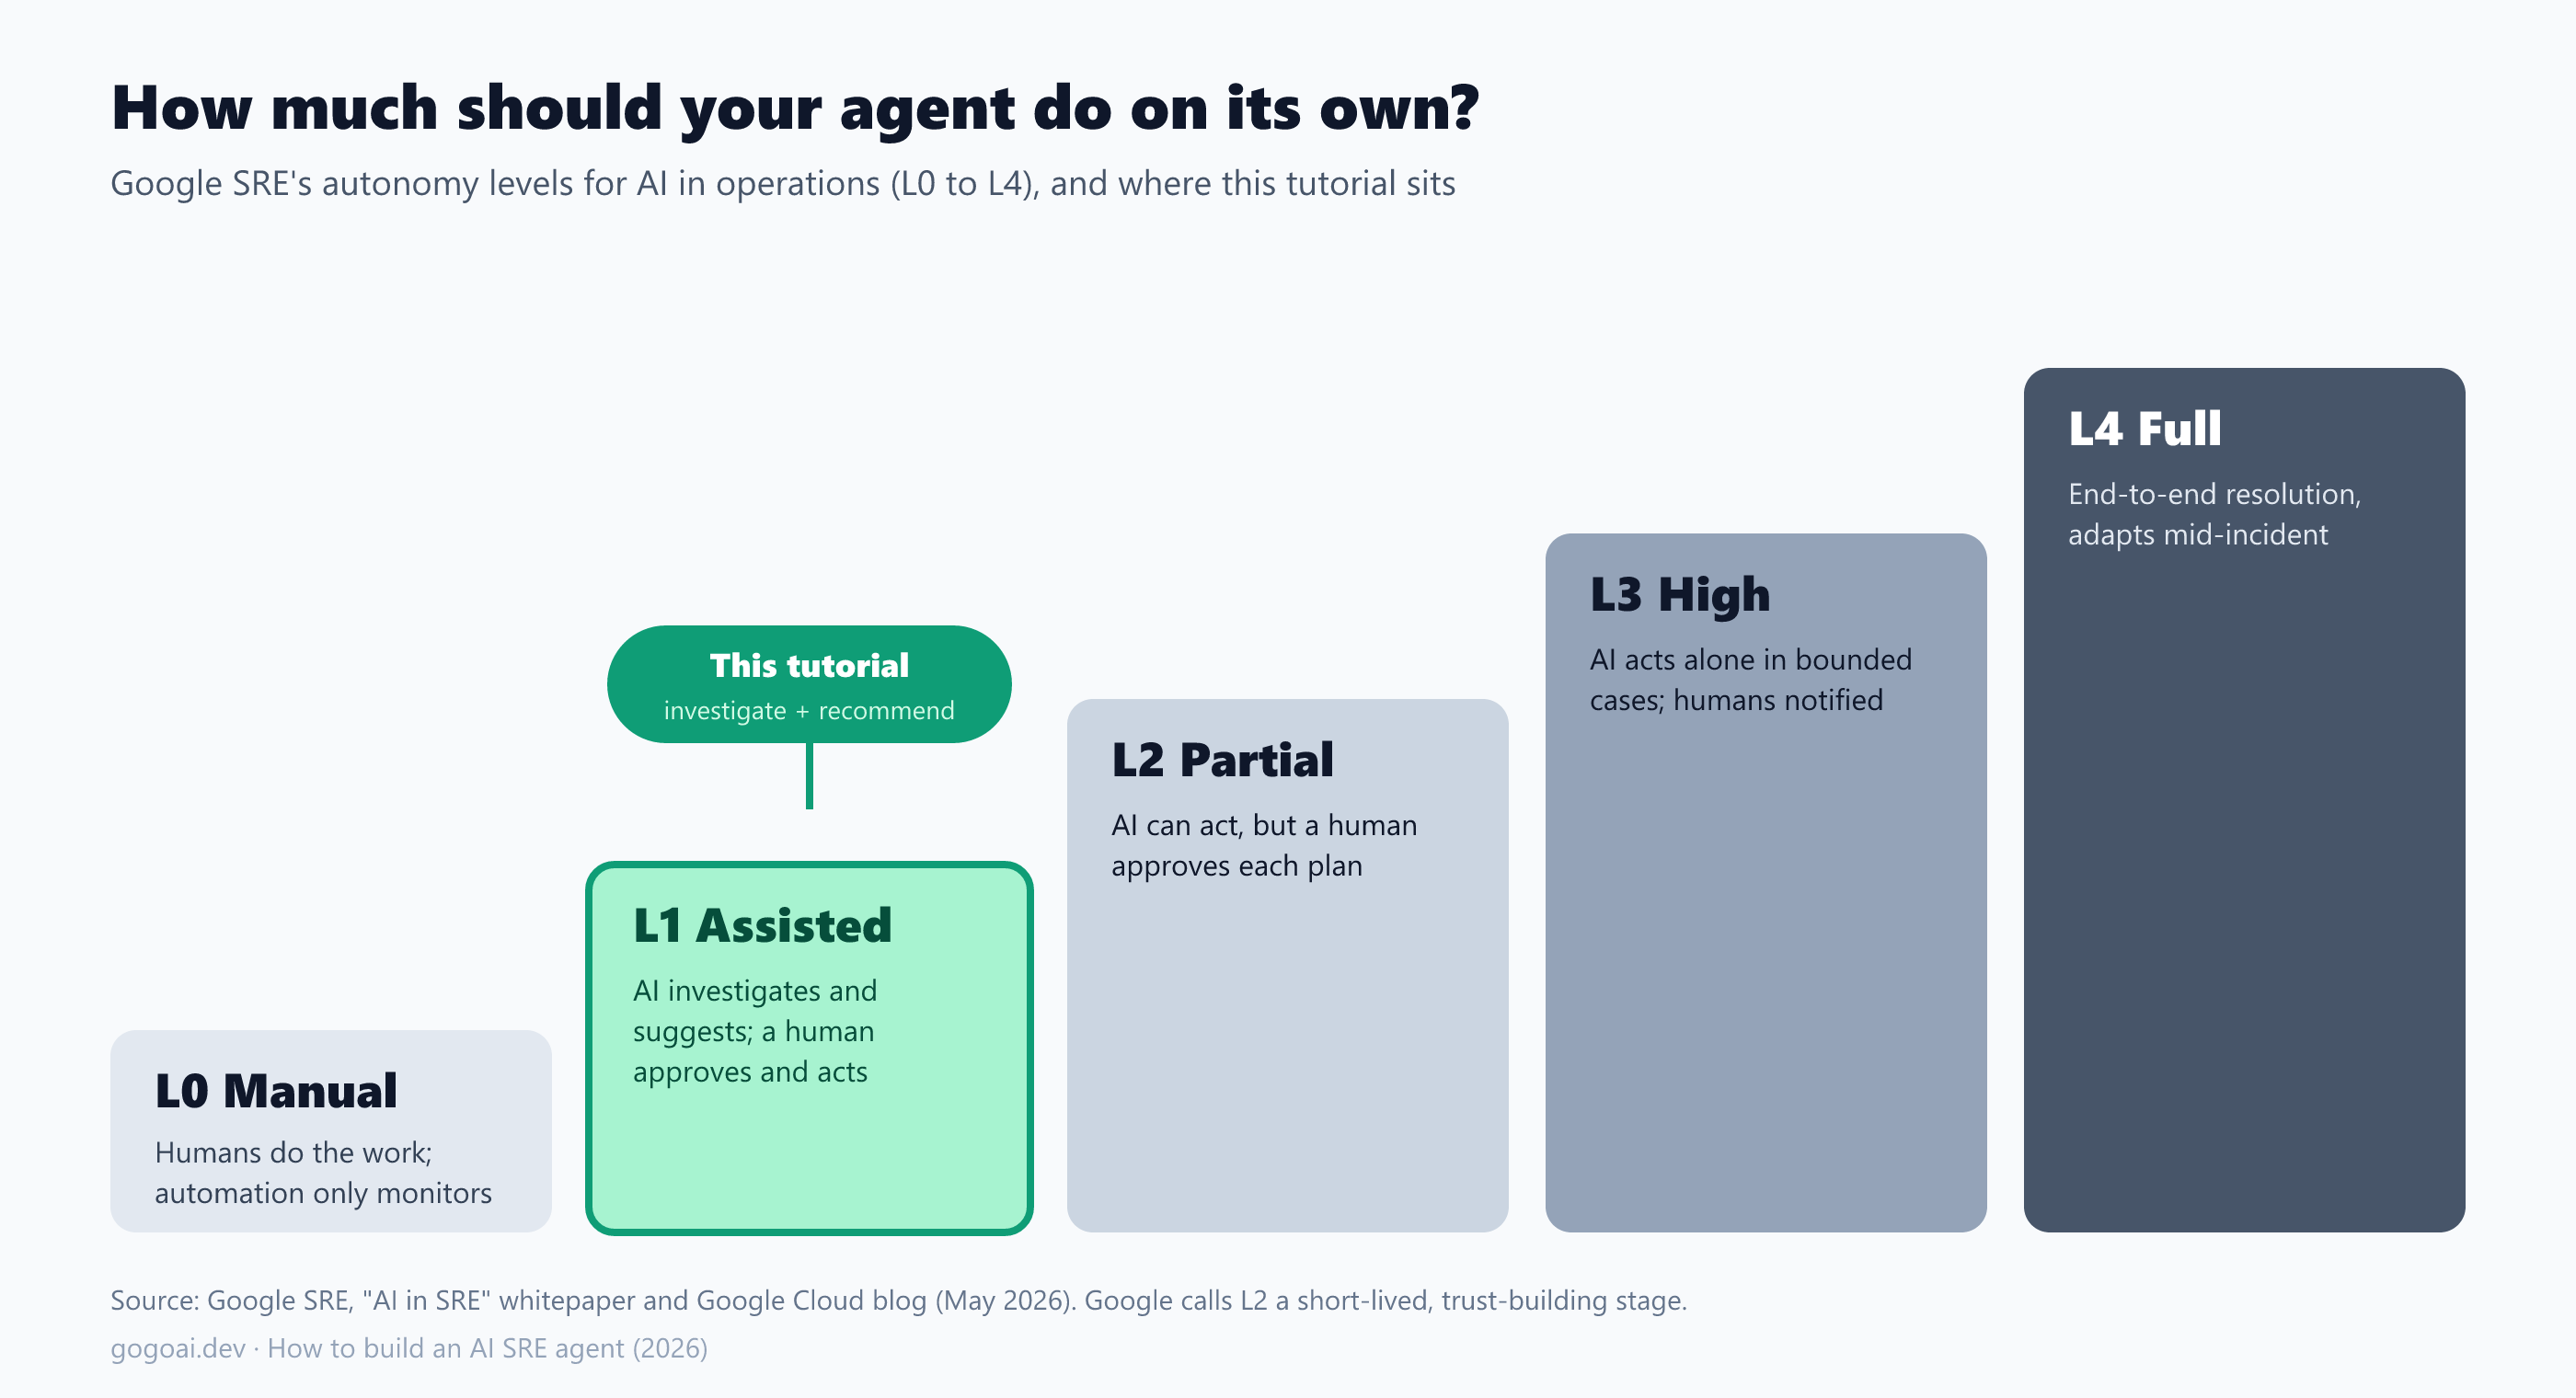
How much should the agent do on its own?
Google's SRE team uses five autonomy levels for AI in operations, from L0 (humans do everything) to L4 (the AI resolves incidents end to end). At L1, "Assisted", the AI investigates and suggests, and a human approves and acts. Google describes L2, where the AI acts but a human approves each plan, as a deliberately short-lived, trust-building stage (Google Cloud blog, Google SRE whitepaper).
The agent in this tutorial works at L1: it investigates and recommends, and a person decides. That is where you should start, too.
The architecture: how an AI SRE agent works
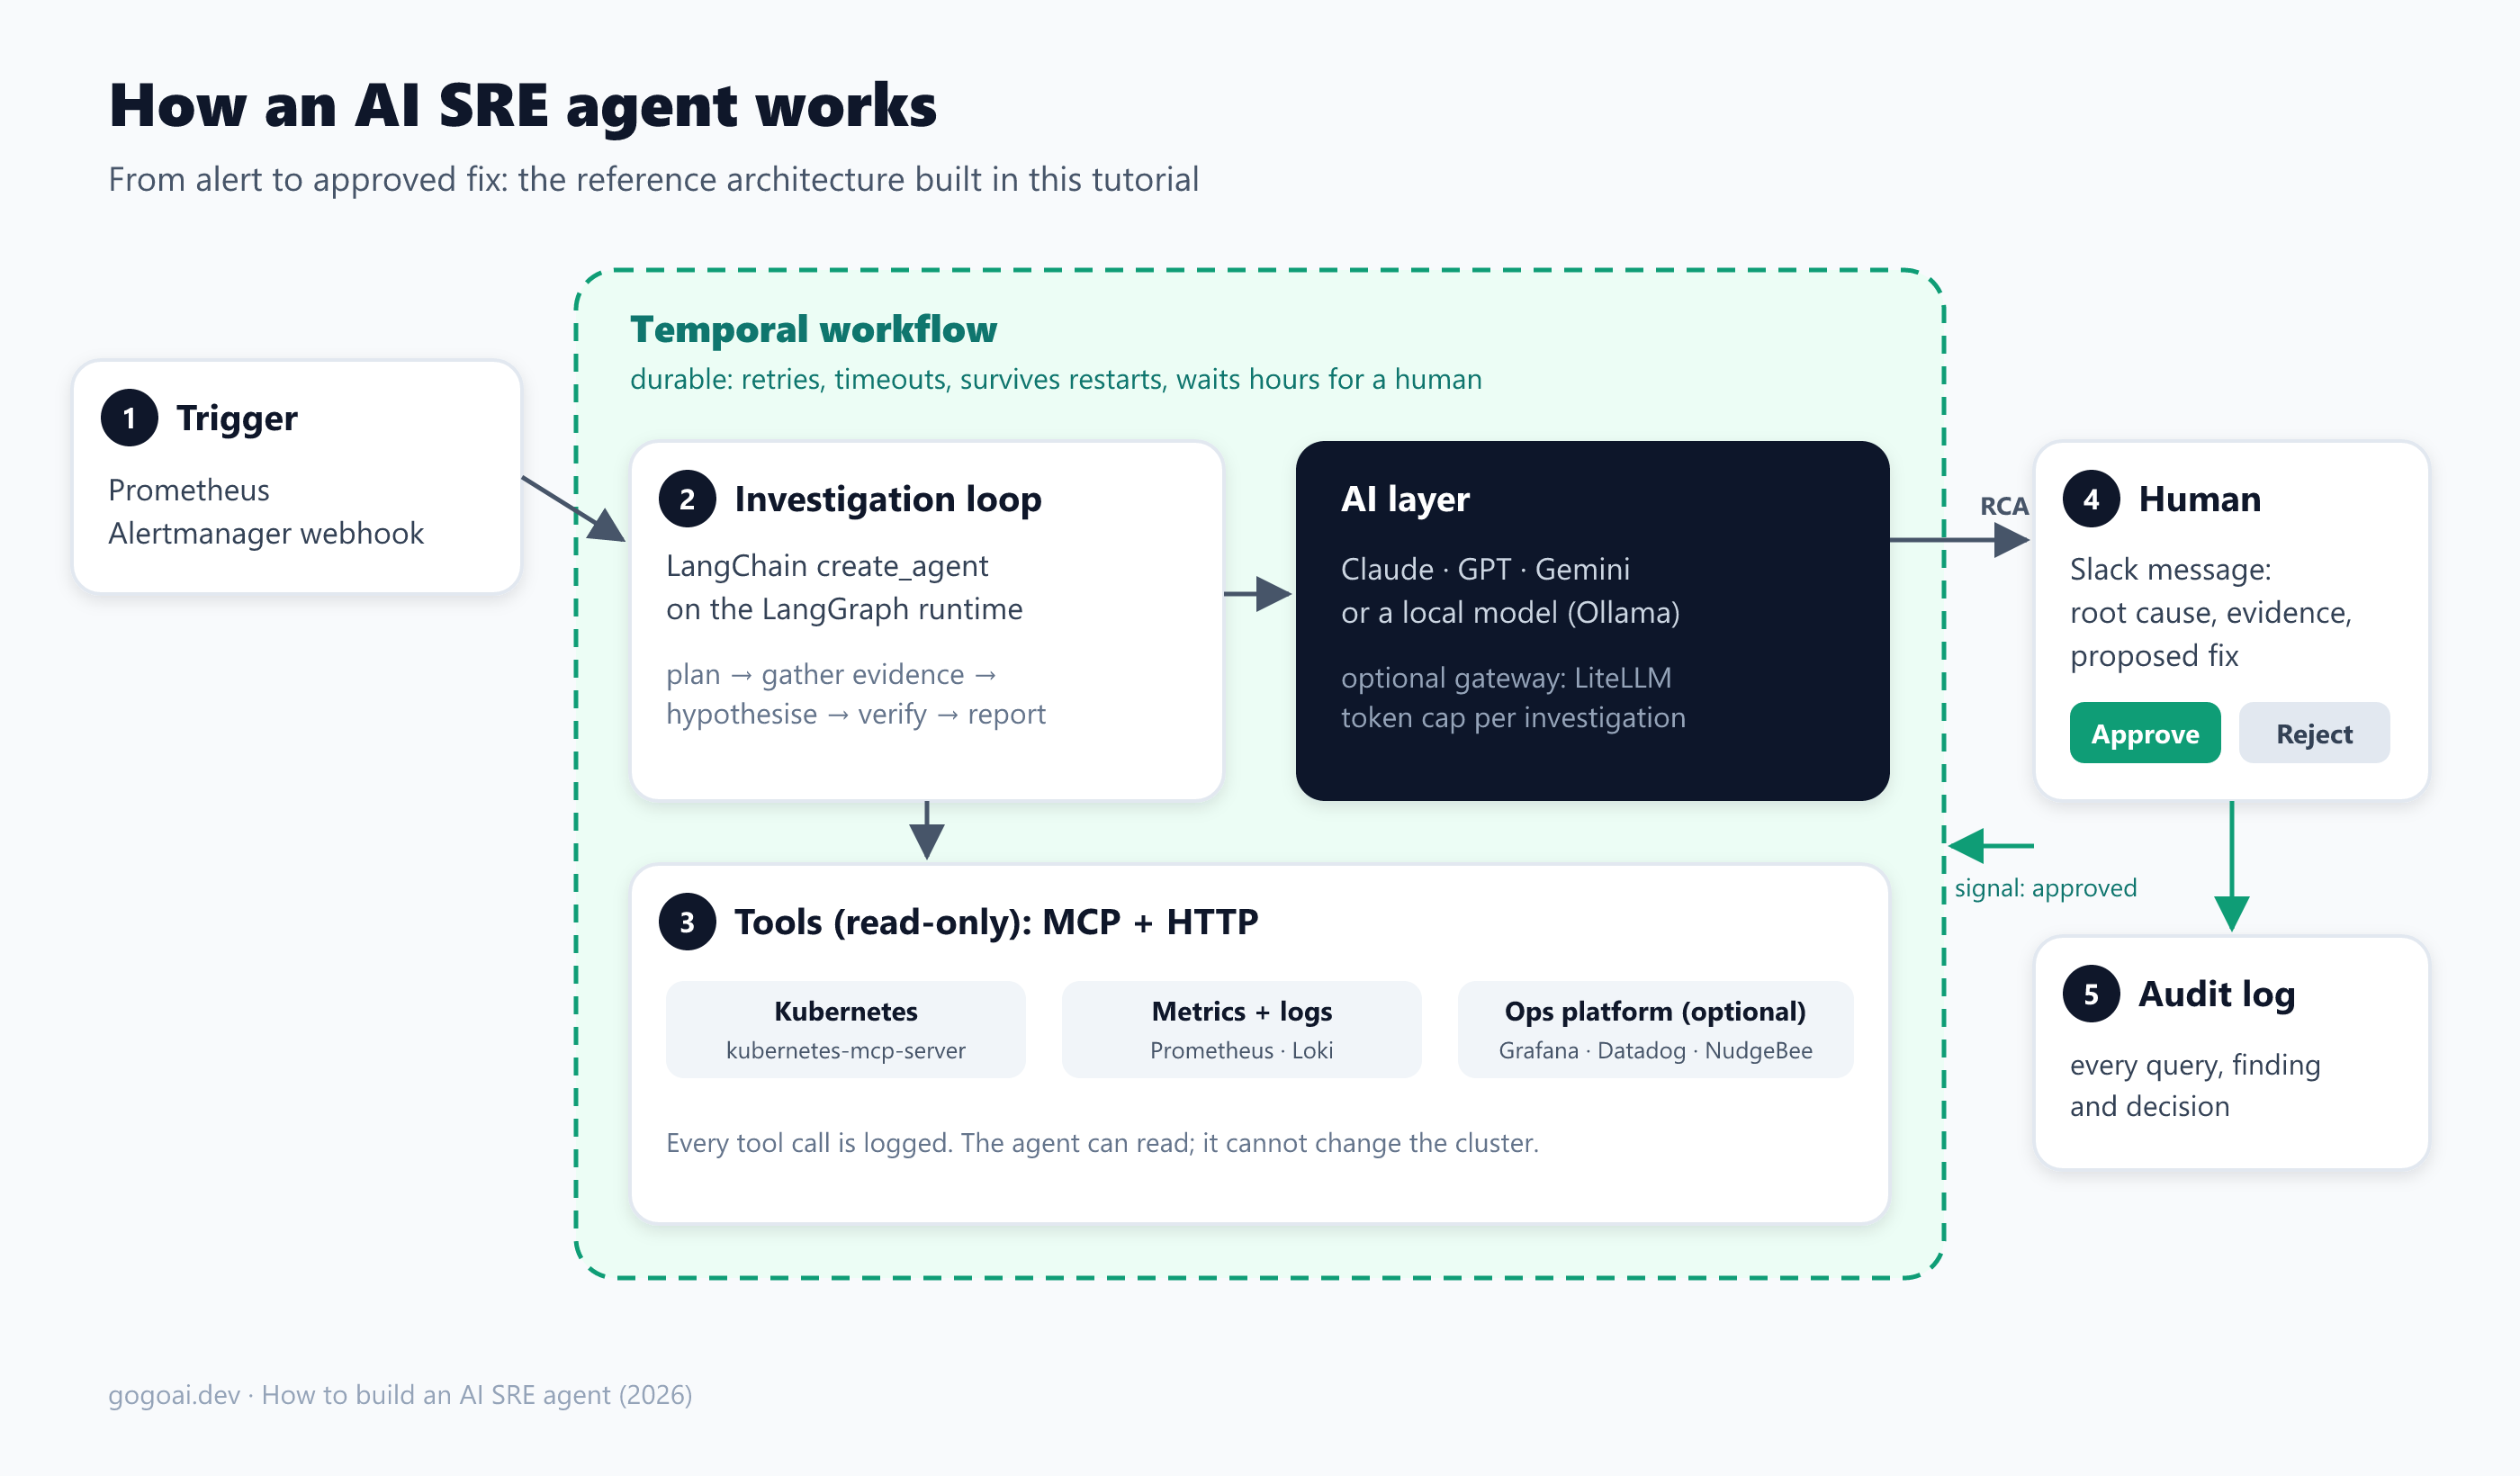
Five building blocks, in the order an alert moves through them:
- Trigger. Prometheus Alertmanager sends each firing alert to a webhook. One alert starts one investigation.
- Investigation loop. An LLM agent plans, gathers evidence, forms hypotheses, tries to disprove them, and writes a report.
- Tools. Read-only access to the cluster, metrics and logs. The agent can look; it cannot change anything.
- Human. A Slack message with the root cause, the evidence and a proposed fix, plus Approve and Reject buttons.
- Audit log. Every query, finding and decision is recorded.
Around all of it sits a Temporal workflow. An investigation can take minutes, call flaky APIs, and then wait hours for a human. Temporal keeps that state durable, retries failed steps, and resumes after a crash.
The investigation loop
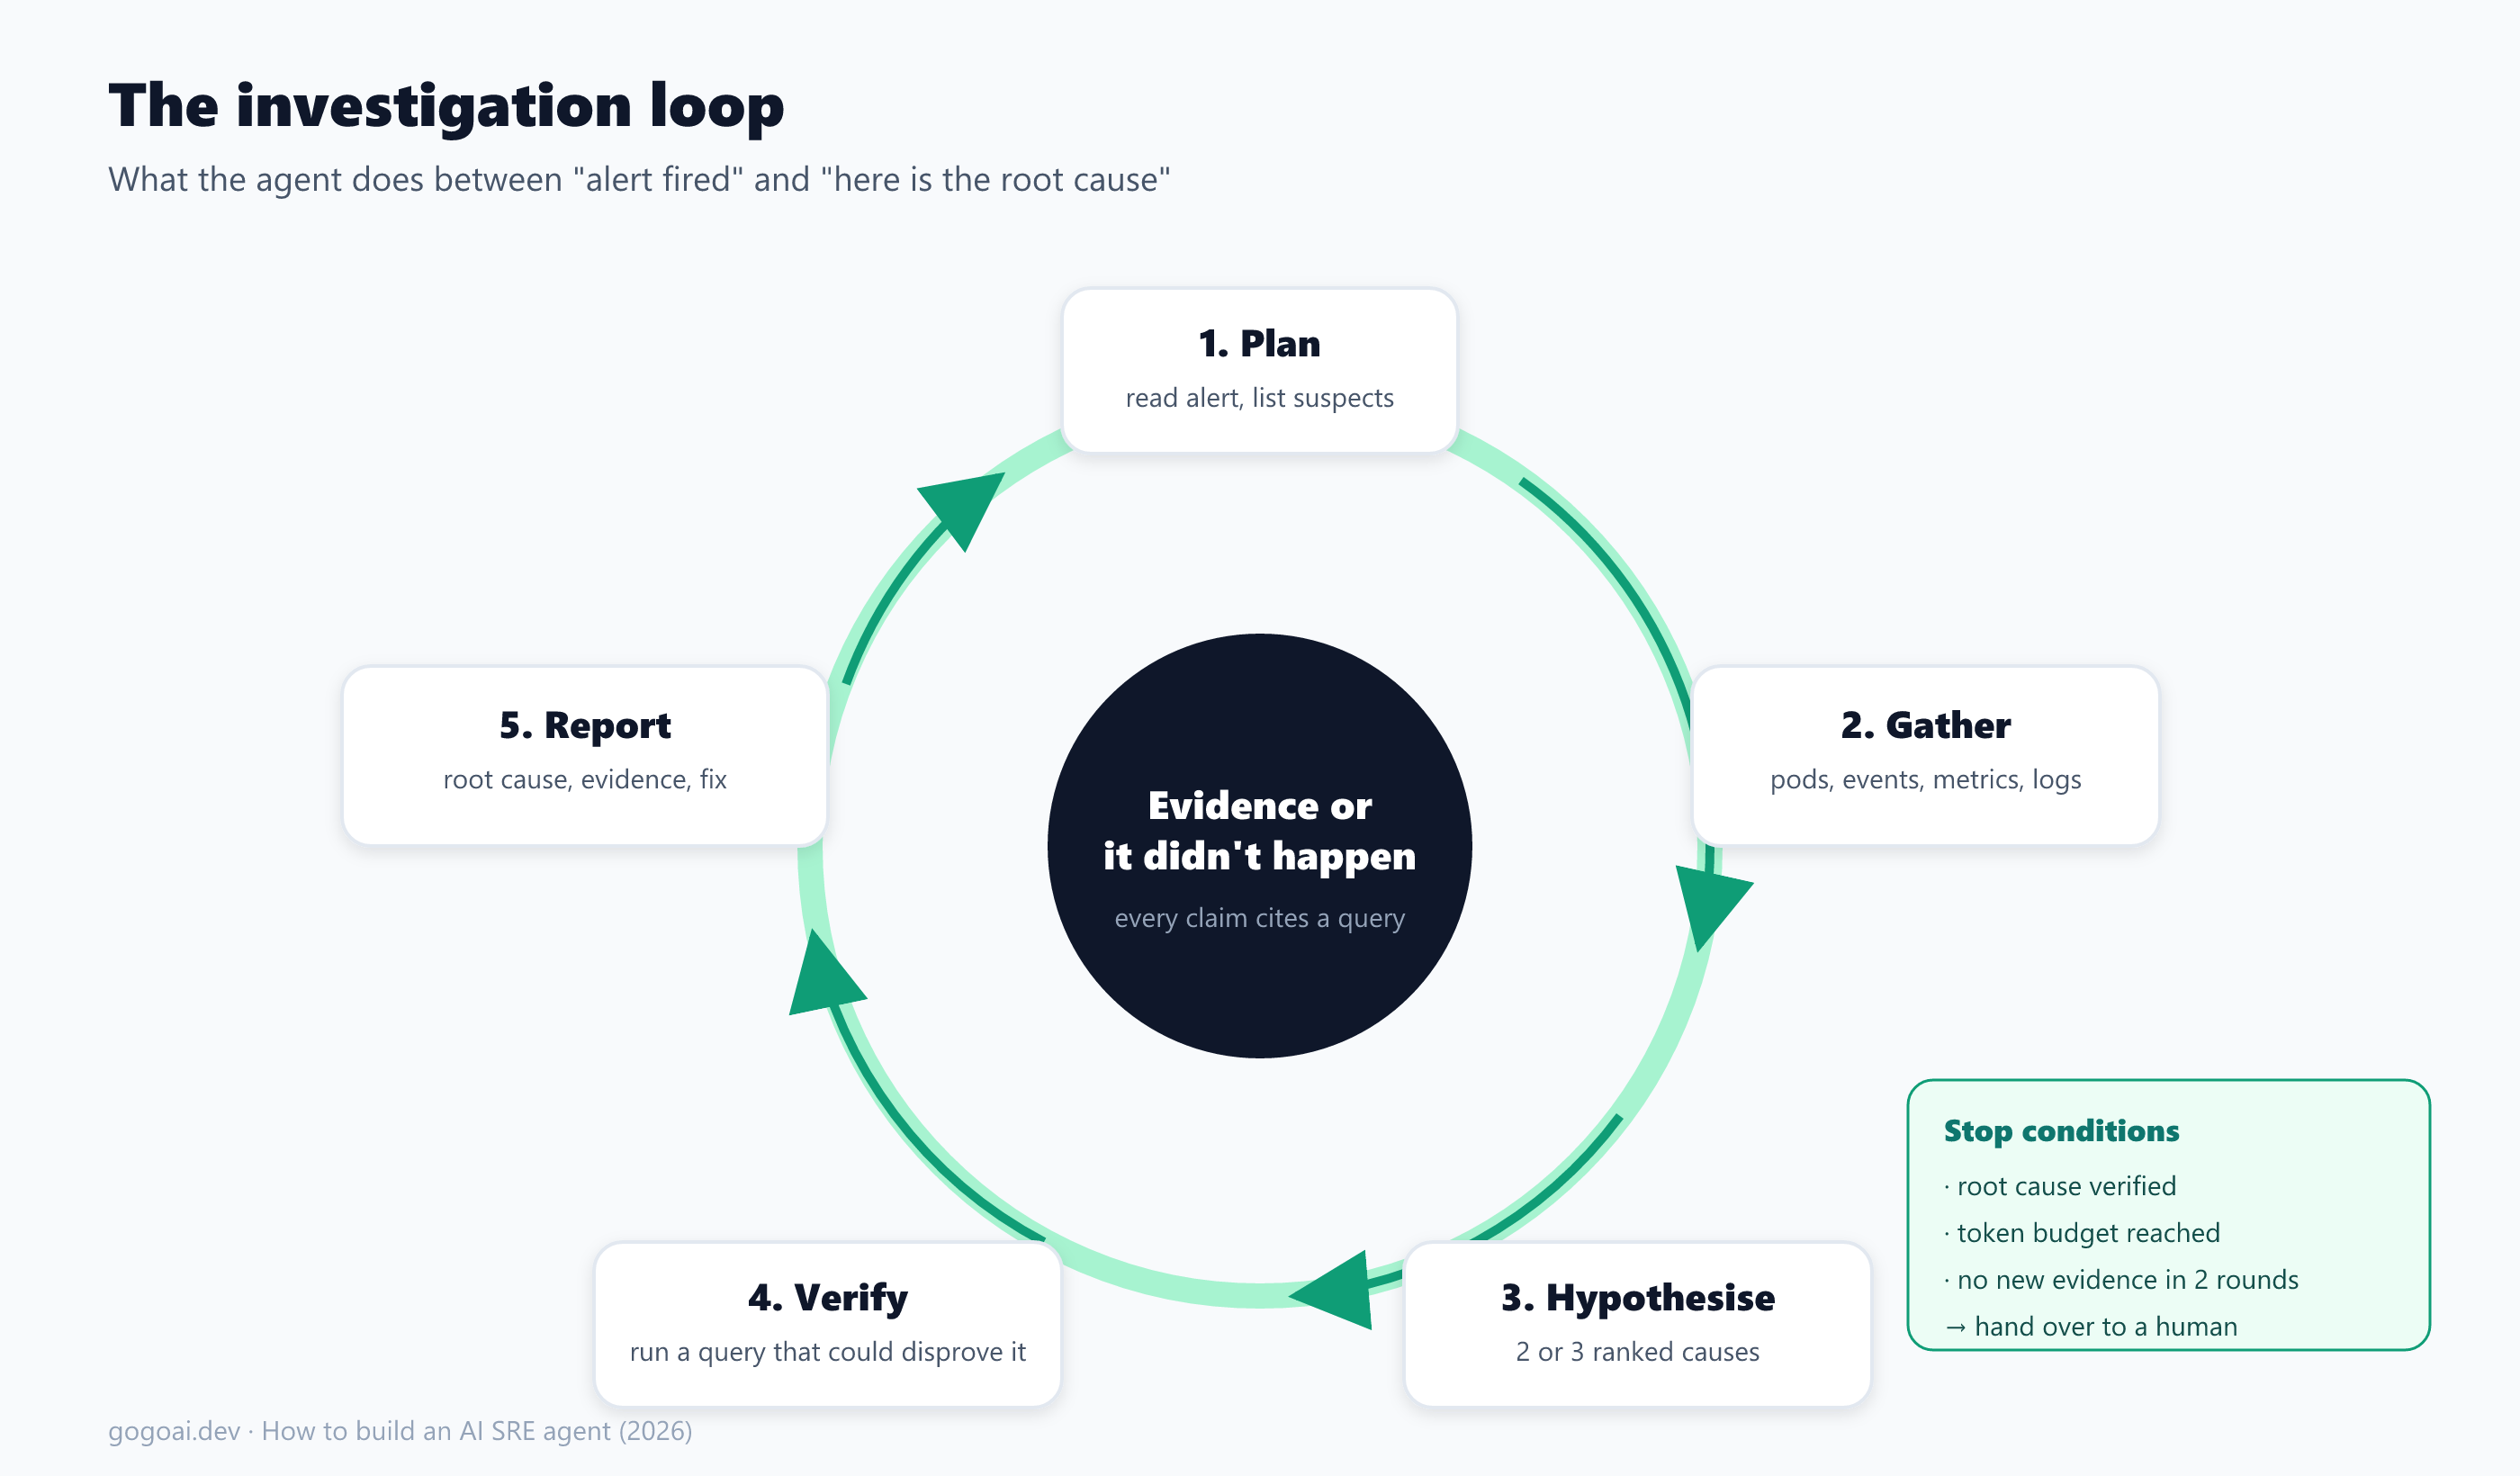
Without rules, an LLM will write a confident paragraph that sounds like a root cause. Make evidence mandatory:
- Plan. Read the alert and list the likely suspects.
- Gather. Query pods, events, metrics and logs for each suspect.
- Hypothesise. Rank two or three possible causes.
- Verify. Run at least one query that could disprove the top hypothesis.
- Report. Root cause, the evidence behind it, and a proposed fix.
Stop when the cause is verified, when the step budget runs out, or when two rounds produce no new evidence. In the last two cases, hand over to a human with what you found.
Choosing your stack
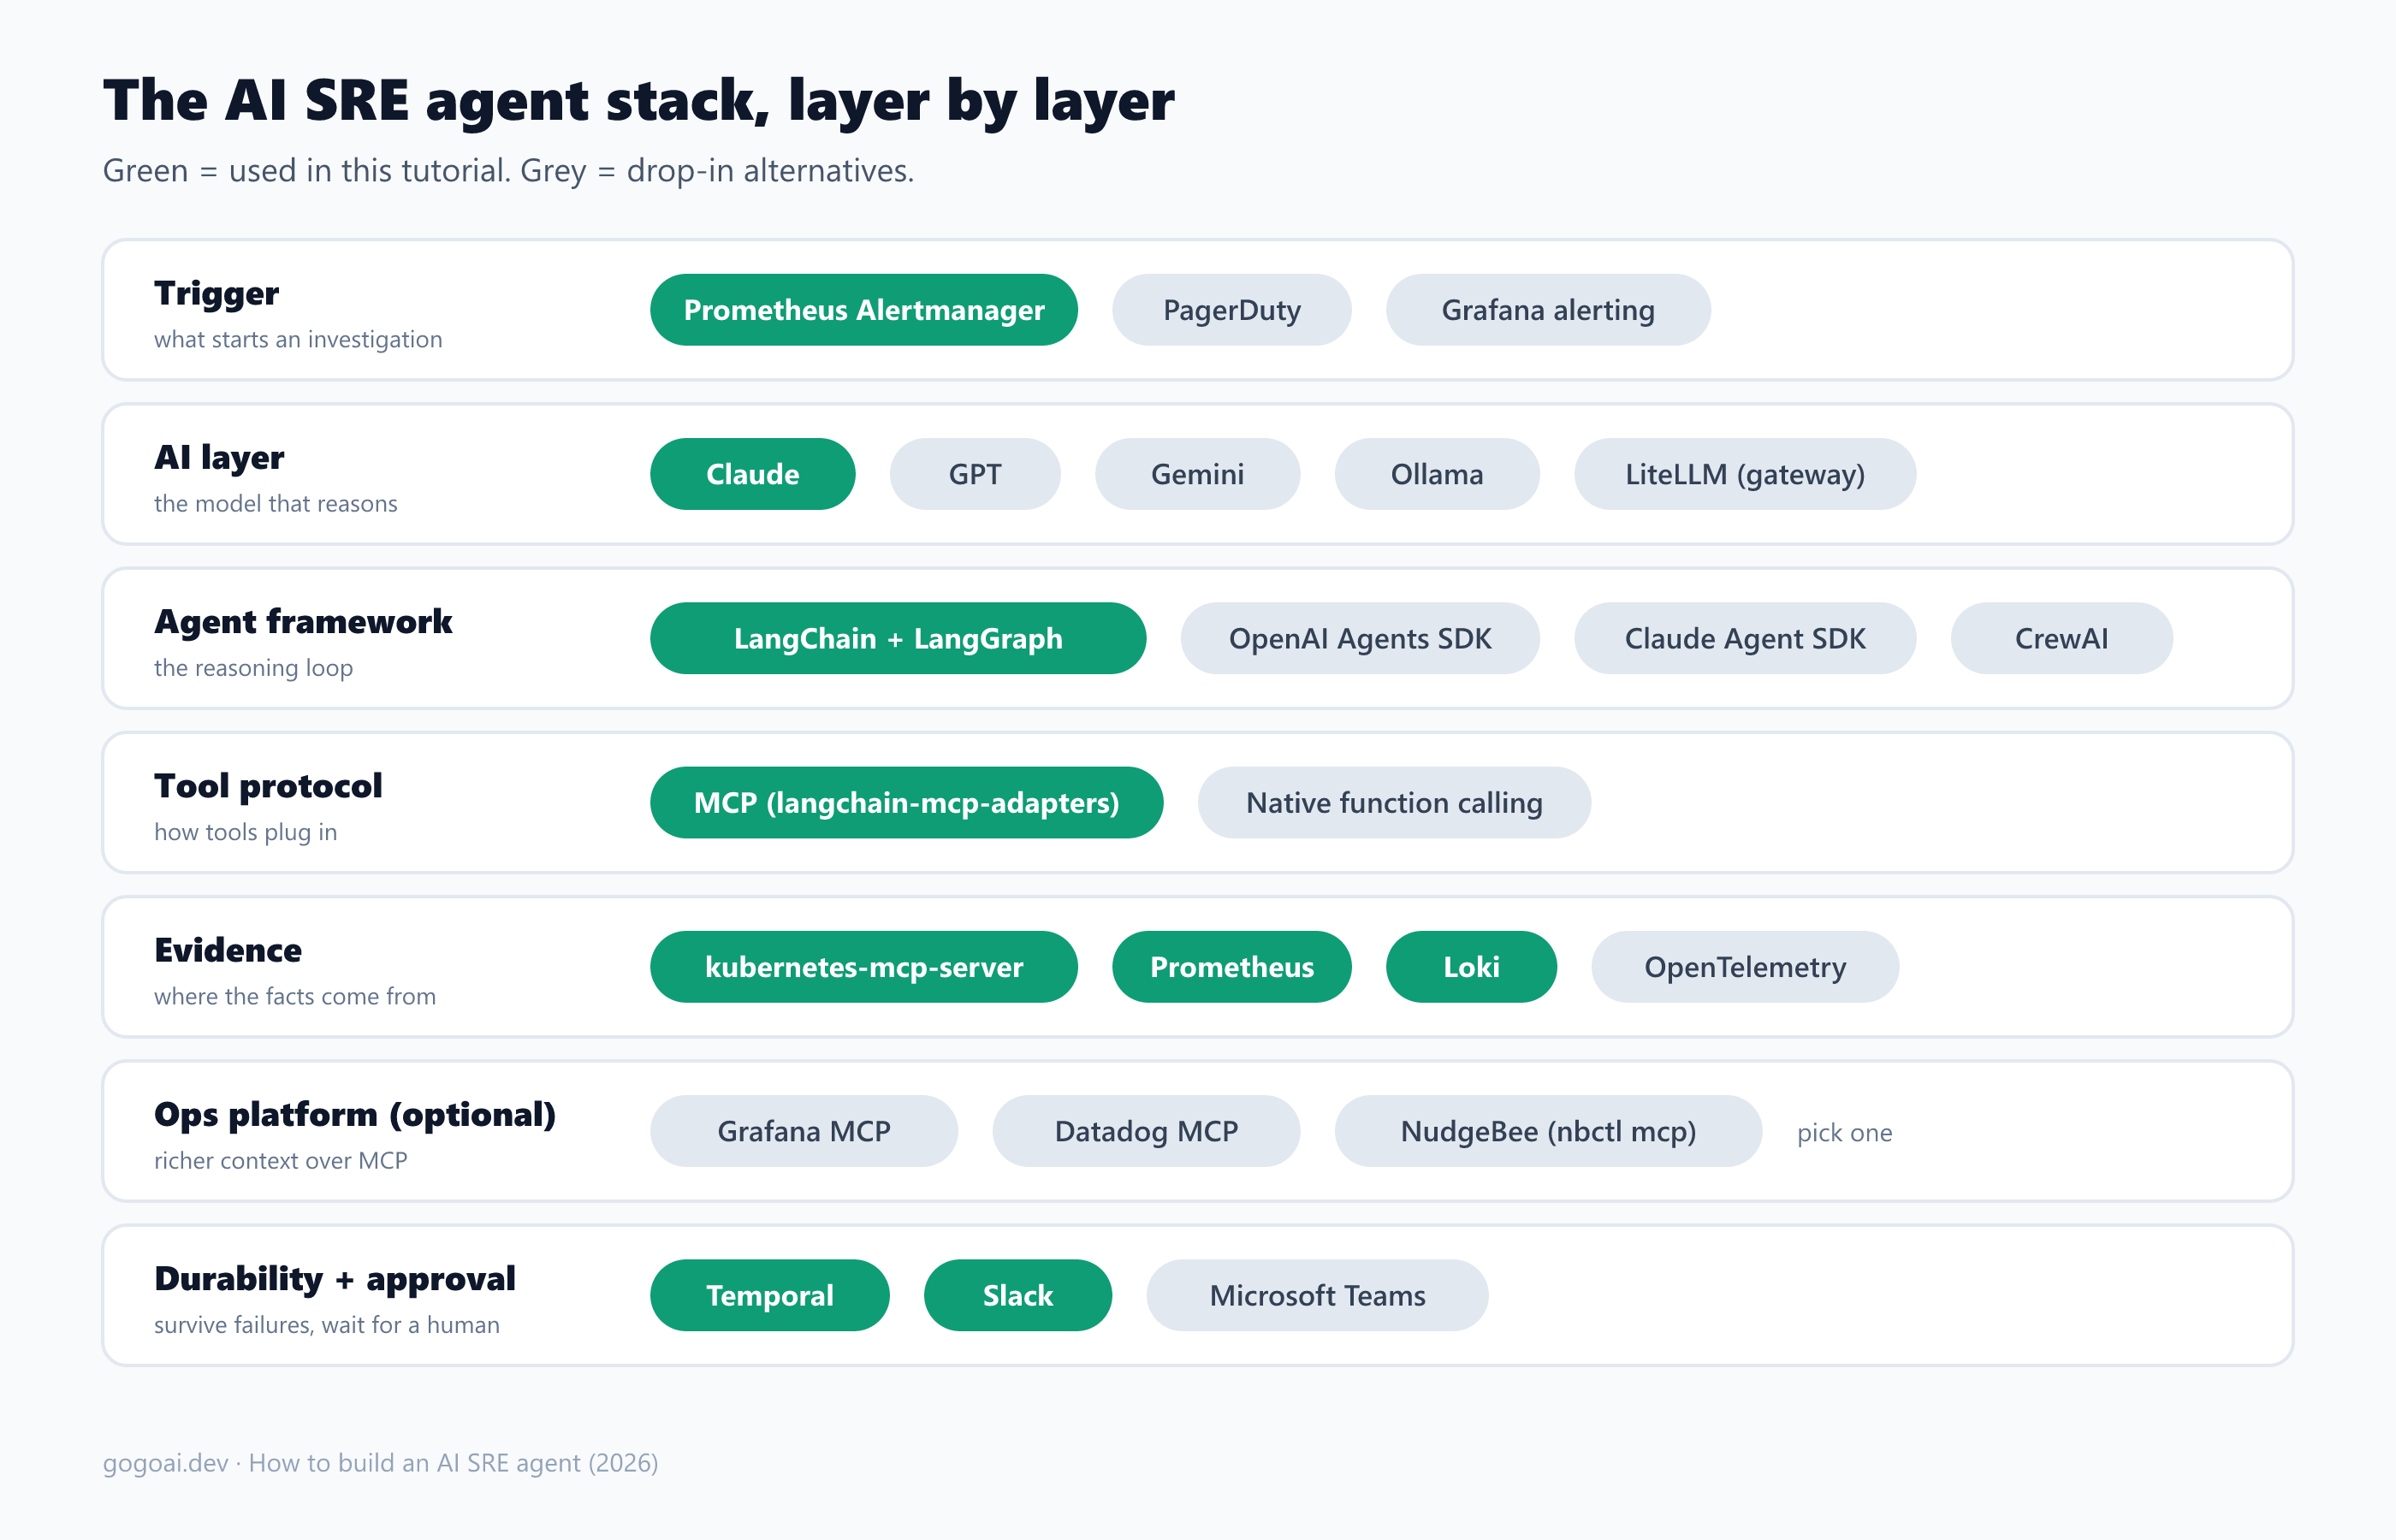
| Layer | Used in this tutorial | Pick an alternative when... |
|---|---|---|
| Trigger | Prometheus Alertmanager | You page from PagerDuty or Grafana alerting instead |
| Agent framework | LangChain create_agent on LangGraph | You prefer the OpenAI Agents SDK, the Claude Agent SDK or CrewAI |
| Tool protocol | MCP via langchain-mcp-adapters | You only have one or two tools and want plain function calling |
| Cluster access | kubernetes-mcp-server, read-only | You already expose clusters through another MCP server |
| Metrics and logs | Prometheus and Loki over their HTTP APIs | You standardise on OpenTelemetry and a different backend |
| Ops platform (optional) | Grafana, Datadog or NudgeBee over MCP | You want correlated context instead of raw queries (see Step 3b) |
| Durable execution | Temporal | You accept losing in-flight investigations on a crash |
| Approval | Slack | Your team lives in Microsoft Teams |
The AI layer: model, gateway and limits
The model does the reasoning, so it decides most of the quality. An investigation is a long chain of tool calls, which makes tool-calling reliability the first thing to test.
| Part | Options | How it plugs in |
|---|---|---|
| Hosted model | Anthropic Claude, OpenAI GPT, Google Gemini | langchain-anthropic, langchain-openai or langchain-google-genai. Switching is one model string |
| Local model | Ollama via langchain-ollama | Good for learning and private data. HolmesGPT's own docs call local-model tool calling "experimental" (docs) |
| Gateway (optional) | LiteLLM | One endpoint for several providers, with fallbacks and spend limits |
Three rules for this layer:
- Budget every investigation. Microsoft's own worked example for Azure SRE Agent puts one incident investigation at about 200,000 input tokens (Microsoft Learn). Cap the number of agent steps so a confused agent cannot loop forever.
- Keep secrets out of prompts. Logs and environment variables can contain credentials. Redact before you send, or use a local model for sensitive clusters.
- Require citations. The system prompt below makes the agent attach evidence to every claim.
If you want to understand what those tokens cost and why long contexts get expensive, see what happens inside one LLM request.
Prerequisites
- A Kubernetes cluster. kind on your laptop is enough.
- Prometheus, Alertmanager and Grafana from the kube-prometheus-stack Helm chart, plus Loki for logs.
- Python 3.11 or newer, Node.js (to run kubernetes-mcp-server with
npx), and an API key for your model provider. - The Temporal CLI, for a local dev server:
temporal server start-dev. - A Slack incoming webhook for the approval message.
Install the Python packages:
pip install "langchain==1.4.2" "langgraph==1.2.11" langchain-anthropic \
  "langchain-mcp-adapters==0.3.2" "temporalio==1.33.0" fastapi uvicorn httpx pydantic
The project has five small files:
ai-sre-agent/
  agent.py        # the investigation loop, tools and prompt
  activities.py   # Temporal activities: investigate, notify Slack, audit
  workflow.py     # the durable workflow with the approval wait
  worker.py       # runs the workflow and activities
  api.py          # Alertmanager webhook and approve/reject endpoints
  k8s-mcp.toml    # read-only config for kubernetes-mcp-server
Step 1: Receive alerts from Alertmanager
Point Alertmanager at the agent. With kube-prometheus-stack, add this under alertmanager.config in your Helm values (Alertmanager configuration reference):
route:
  receiver: ai-sre-agent
receivers:
  - name: ai-sre-agent
    webhook_configs:
      - url: http://ai-sre-agent.default.svc:8080/alerts
        send_resolved: false
The receiver starts one Temporal workflow per firing alert. Using the alert's fingerprint as the workflow ID means a repeated notification for the same alert does not start a second investigation.
# api.py
import os
from fastapi import FastAPI, HTTPException, Request
from temporalio.client import Client
from temporalio.exceptions import WorkflowAlreadyStartedError
from workflow import InvestigateAlert

app = FastAPI()
_client: Client | None = None

async def temporal() -> Client:
    global _client
    if _client is None:
        _client = await Client.connect(os.environ.get("TEMPORAL_ADDRESS", "localhost:7233"))
    return _client

@app.post("/alerts")
async def receive_alerts(request: Request):
    payload = await request.json()
    client = await temporal()
    started = []
    for alert in payload.get("alerts", []):
        if alert.get("status") != "firing":
            continue
        workflow_id = f"investigate-{alert['fingerprint']}"
        try:
            await client.start_workflow(
                InvestigateAlert.run, alert, id=workflow_id, task_queue="ai-sre"
            )
            started.append(workflow_id)
        except WorkflowAlreadyStartedError:
            pass  # already investigating this alert
    return {"started": started}

@app.get("/decide/{workflow_id}/{decision}")
async def decide(workflow_id: str, decision: str):
    if decision not in ("approve", "reject"):
        raise HTTPException(status_code=400, detail="decision must be approve or reject")
    handle = (await temporal()).get_workflow_handle(workflow_id)
    await handle.signal(InvestigateAlert.decide, decision)
    return {"workflow_id": workflow_id, "decision": decision}
Step 2: Build the investigation loop
The loop uses LangChain's create_agent, which runs on the LangGraph runtime and handles the call-tool, read-result, decide-next-step cycle for you. Two things make it an SRE agent rather than a chatbot: the system prompt, and a structured output schema that forces a root cause, evidence and a fix.
# agent.py (part 1: prompt and output schema)
import os
from pydantic import BaseModel, Field

MODEL = os.environ.get("AGENT_MODEL", "anthropic:claude-sonnet-5")

SYSTEM_PROMPT = """You are an SRE investigating a production alert.
Rules:
- You have read-only tools. Never suggest running a command you have not justified with evidence.
- Work in this order: plan suspects, gather evidence, rank 2-3 hypotheses, run at least one
  query that could DISPROVE your top hypothesis, then report.
- Every claim in your report must cite the tool call and result that supports it.
- If the evidence is inconclusive, say so and list what a human should check next.
- Keep the proposed fix to the smallest safe change (for example, a rollback or a limit change)."""

class Evidence(BaseModel):
    source: str = Field(description="Tool name and query, e.g. query_prometheus: <promql>")
    finding: str = Field(description="What the result showed")

class RCA(BaseModel):
    summary: str = Field(description="One-sentence root cause")
    confidence: str = Field(description="high, medium or low")
    evidence: list[Evidence]
    proposed_fix: str = Field(description="Smallest safe change a human can approve")
    next_checks: list[str] = Field(default_factory=list)
Swap AGENT_MODEL for another provider string (for example an openai: or ollama: model) without touching the rest of the code. Check your provider's docs for the current model names.
Step 3: Give the agent tools with MCP
The Model Context Protocol lets you plug tool servers into any agent. langchain-mcp-adapters turns each MCP server's tools into LangChain tools, so the agent code does not care where a tool comes from.
3a. Raw tools: Kubernetes, Prometheus and Loki
Start with tools that work on any cluster. Run kubernetes-mcp-server in read-only mode, which exposes only tools marked read-only and "prevents any write operations on the cluster", per its configuration docs:
# k8s-mcp.toml
read_only = true
Give the process a kubeconfig for a service account bound to Kubernetes' built-in view role (RBAC docs). Read-only mode plus a read-only identity is belt and braces.
Prometheus and Loki are simple enough to call over their HTTP APIs:
# agent.py (part 2: tools)
import time
import httpx
from langchain_core.tools import tool
from langchain_mcp_adapters.client import MultiServerMCPClient

PROMETHEUS_URL = os.environ.get("PROMETHEUS_URL", "http://localhost:9090")
LOKI_URL = os.environ.get("LOKI_URL", "http://localhost:3100")

@tool
async def query_prometheus(promql: str) -> str:
    """Run an instant PromQL query against Prometheus and return the JSON result."""
    async with httpx.AsyncClient(timeout=20) as http:
        r = await http.get(f"{PROMETHEUS_URL}/api/v1/query", params={"query": promql})
        return r.text[:8000]

@tool
async def query_loki(logql: str, minutes: int = 30) -> str:
    """Run a LogQL query over the last N minutes and return matching log lines."""
    end = time.time_ns()
    start = end - minutes * 60 * 1_000_000_000
    async with httpx.AsyncClient(timeout=20) as http:
        r = await http.get(
            f"{LOKI_URL}/loki/api/v1/query_range",
            params={"query": logql, "start": start, "end": end, "limit": 200},
        )
        return r.text[:8000]

MCP_SERVERS = {
    "kubernetes": {
        "command": "npx",
        "args": ["-y", "kubernetes-mcp-server@latest", "--config", "k8s-mcp.toml"],
        "transport": "stdio",
    },
}
3b. Plug in an ops platform's MCP server (optional)
Raw queries work, but the agent spends many steps rebuilding context a platform already has, such as which alerts are related or what changed recently. If you run one of these, add its MCP server to MCP_SERVERS. The agent code stays the same.
Option 1: Grafana. mcp-grafana (Apache 2.0) lets the agent run PromQL and LogQL through your Grafana data sources and read dashboards. It works with self-managed Grafana or Grafana Cloud. The --disable-write flag blocks changes to dashboards, alerts and incidents.
MCP_SERVERS["grafana"] = {
    "command": "mcp-grafana",
    "args": ["-t", "stdio", "--disable-write"],
    "env": {
        "GRAFANA_URL": os.environ["GRAFANA_URL"],
        "GRAFANA_SERVICE_ACCOUNT_TOKEN": os.environ["GRAFANA_SERVICE_ACCOUNT_TOKEN"],
    },
    "transport": "stdio",
}
Option 2: Datadog. The Datadog MCP Server is a remote, generally available server covering APM, logs, metrics, monitors and dashboards. Custom agents can authenticate with API and application key headers. Copy the endpoint URL for your Datadog site from the setup docs.
MCP_SERVERS["datadog"] = {
    "transport": "http",
    "url": os.environ["DATADOG_MCP_URL"],  # the endpoint for your Datadog site
    "headers": {
        "DD_API_KEY": os.environ["DD_API_KEY"],
        "DD_APPLICATION_KEY": os.environ["DD_APPLICATION_KEY"],
    },
}
Option 3: NudgeBee. nbctl (Apache 2.0) is NudgeBee's CLI, and nbctl mcp exposes it as an MCP server. The agent gets NudgeBee's AI investigation tool plus events, logs, metrics, traces, SLOs and tickets. You can connect it to either deployment:
- NudgeBee Cloud SaaS. Sign up at nudgebee.com, create an API key from your profile, then run
nbctl configure add defaultand enter the Cloud API endpoint and your key. - Self-hosted. Install NudgeBee into your own cluster with its Helm chart. The chart bundles Postgres, RabbitMQ, Redis, Qdrant and Temporal as subcharts, so give your kind cluster enough memory. Then run
nbctl configure add defaultwith your install's API endpoint and a key from your profile. The optional eBPF profiling agent needs privileged node access, and you can switch it off.
MCP_SERVERS["nudgebee"] = {
    "command": "nbctl",
    "args": ["mcp"],
    "transport": "stdio",
}
nbctl also exposes write actions, such as creating tickets. Give the agent its own API key, and filter nbctl's write tools out of the agent's tool list or put them behind the approval step.
Step 4: Wire the loop together
Now load the tools and run the agent. recursion_limit caps the number of steps, which is your budget guard.
# agent.py (part 3: run an investigation)
from langchain.agents import create_agent

async def run_investigation(alert: dict) -> dict:
    mcp = MultiServerMCPClient(MCP_SERVERS)
    tools = await mcp.get_tools() + [query_prometheus, query_loki]

    agent = create_agent(
        model=MODEL,
        tools=tools,
        system_prompt=SYSTEM_PROMPT,
        response_format=RCA,
    )

    labels = alert.get("labels", {})
    annotations = alert.get("annotations", {})
    question = (
        f"Alert {labels.get('alertname')} is firing.\n"
        f"Labels: {labels}\nAnnotations: {annotations}\n"
        "Investigate and report the root cause."
    )
    result = await agent.ainvoke(
        {"messages": [{"role": "user", "content": question}]},
        config={"recursion_limit": 30},
    )
    rca: RCA = result["structured_response"]

    tool_calls = [
        {"tool": call["name"], "args": call["args"]}
        for message in result["messages"]
        for call in (getattr(message, "tool_calls", None) or [])
    ]
    return {"rca": rca.model_dump(), "tool_calls": tool_calls}
Step 5: Make it durable with Temporal
An investigation calls an LLM and several APIs, any of which can time out, and then it waits for a person who may be asleep. Temporal turns that into a workflow that retries failed steps and survives restarts. The workflow code must be deterministic, so the investigation itself runs as an activity, and the workflow only orchestrates.
# activities.py
import json
import os
import httpx
from temporalio import activity

@activity.defn
async def investigate(alert: dict) -> dict:
    from agent import run_investigation
    return await run_investigation(alert)

@activity.defn
async def notify_slack(workflow_id: str, result: dict) -> None:
    rca = result["rca"]
    base = os.environ["APPROVAL_BASE_URL"]  # where api.py is reachable
    evidence = "\n".join(f"- {e['source']}: {e['finding']}" for e in rca["evidence"])
    text = (
        f"*Root cause ({rca['confidence']} confidence):* {rca['summary']}\n"
        f"*Evidence:*\n{evidence}\n*Proposed fix:* {rca['proposed_fix']}"
    )
    blocks = [
        {"type": "section", "text": {"type": "mrkdwn", "text": text}},
        {"type": "actions", "elements": [
            {"type": "button", "text": {"type": "plain_text", "text": "Approve"},
             "style": "primary", "url": f"{base}/decide/{workflow_id}/approve"},
            {"type": "button", "text": {"type": "plain_text", "text": "Reject"},
             "url": f"{base}/decide/{workflow_id}/reject"},
        ]},
    ]
    async with httpx.AsyncClient(timeout=10) as http:
        await http.post(os.environ["SLACK_WEBHOOK_URL"], json={"text": rca["summary"], "blocks": blocks})

@activity.defn
async def write_audit(alert: dict, result: dict, decision: str) -> None:
    record = {"alert": alert, "result": result, "decision": decision}
    with open(os.environ.get("AUDIT_LOG", "audit.jsonl"), "a", encoding="utf-8") as f:
        f.write(json.dumps(record) + "\n")
# workflow.py
import asyncio
from datetime import timedelta
from temporalio import workflow
from temporalio.common import RetryPolicy

with workflow.unsafe.imports_passed_through():
    from activities import investigate, notify_slack, write_audit

@workflow.defn
class InvestigateAlert:
    def __init__(self) -> None:
        self.decision: str | None = None

    @workflow.signal
    def decide(self, decision: str) -> None:
        self.decision = decision

    @workflow.run
    async def run(self, alert: dict) -> dict:
        result = await workflow.execute_activity(
            investigate, alert,
            start_to_close_timeout=timedelta(minutes=10),
            retry_policy=RetryPolicy(maximum_attempts=3),
        )
        await workflow.execute_activity(
            notify_slack, args=[workflow.info().workflow_id, result],
            start_to_close_timeout=timedelta(seconds=30),
        )
        try:
            await workflow.wait_condition(lambda: self.decision is not None, timeout=timedelta(hours=4))
        except asyncio.TimeoutError:
            self.decision = "expired"
        await workflow.execute_activity(
            write_audit, args=[alert, result, self.decision],
            start_to_close_timeout=timedelta(seconds=30),
        )
        return {"result": result, "decision": self.decision}
# worker.py
import asyncio
import os
from temporalio.client import Client
from temporalio.worker import Worker
from activities import investigate, notify_slack, write_audit
from workflow import InvestigateAlert

async def main() -> None:
    client = await Client.connect(os.environ.get("TEMPORAL_ADDRESS", "localhost:7233"))
    worker = Worker(
        client,
        task_queue="ai-sre",
        workflows=[InvestigateAlert],
        activities=[investigate, notify_slack, write_audit],
    )
    await worker.run()

if __name__ == "__main__":
    asyncio.run(main())
Going further: this design makes the whole investigation one retryable activity. Temporal also has a LangGraph plugin, currently in public preview, that runs individual graph nodes as activities, so a crash mid-investigation resumes from the last completed step instead of starting over (announcement).
Step 6: Human approval and the audit trail
The Slack message carries the root cause, the evidence and the proposed fix, and its buttons call the /decide endpoint from Step 1, which signals the waiting workflow. The workflow then writes the alert, the agent's full result including every tool call, and the human's decision to the audit log.
Two things to change before production:
- Authenticate approvals. The link buttons here are fine on a laptop. In production, use Slack interactivity so Slack signs each click and you know who approved.
- Keep execution separate. The agent only recommends. If you later let an approved fix run automatically, run it through a separate, pre-approved runbook with its own permissions, never through the agent's tools.
Step 7: Run it and break something on purpose
Start the pieces in four terminals:
temporal server start-dev
python worker.py
uvicorn api:app --port 8080
kubectl port-forward svc/kube-prometheus-stack-prometheus 9090 -n monitoring
The Prometheus service name depends on your Helm release name; kubectl get svc -n monitoring shows it.
Create a pod that will be OOMKilled, because its memory limit is far below what it tries to use:
# memhog.yaml
apiVersion: v1
kind: Pod
metadata:
  name: memhog
spec:
  containers:
    - name: memhog
      image: polinux/stress
      resources:
        limits:
          memory: "64Mi"
      command: ["stress"]
      args: ["--vm", "1", "--vm-bytes", "256M", "--vm-hang", "1"]
kubectl apply -f memhog.yaml
kube-prometheus-stack ships a KubePodCrashLooping alert, but by default it waits 15 minutes before firing. To test straight away, send the receiver a hand-made alert in Alertmanager's webhook format:
curl -X POST localhost:8080/alerts -H 'Content-Type: application/json' -d '{
  "alerts": [{
    "status": "firing",
    "fingerprint": "test-memhog-1",
    "labels": {"alertname": "KubePodCrashLooping", "namespace": "default", "pod": "memhog"},
    "annotations": {"description": "Pod default/memhog is crash looping."}
  }]
}'
A good report for this case names the OOMKilled termination reason from the pod's status, shows the 64Mi limit against the memory the container asked for, and proposes raising the limit or fixing the workload, with each point tied to the query that proved it. If your agent's report lacks the evidence lines, tighten the system prompt before trying anything harder.
Then try a second failure, such as a deployment with an image tag that does not exist (ImagePullBackOff), and compare how many steps each investigation took.
Guardrails checklist
- Read-only by default:
read_only = truefor Kubernetes,--disable-writefor Grafana, and a dedicated API key per platform with its write tools filtered out. - Least privilege: a dedicated service account bound to the
viewrole, never your own kubeconfig. - Step and token budgets:
recursion_limitplus a spend limit at the provider or gateway. - No secrets in prompts: redact tokens and credentials from logs before they reach the model.
- Humans approve changes: the agent recommends; a person decides; execution goes through a separate runbook.
- Audit everything: keep every tool call and decision, and review failures weekly.
- Evaluate before trusting: replay ten past incidents and score whether the agent found the real cause. Google's SRE team gates moves up its autonomy ladder on success rates measured against human-verified data.
Build your own, or use an existing agent?
Building teaches you exactly how the pieces fit, and it is the right call when you need custom tools or a custom approval flow. If you would rather start from something that already works, these are the options worth knowing:
HolmesGPT. What it is: an open-source SRE agent, a CNCF Sandbox project under Apache 2.0 (GitHub). Best for: a free investigation agent with 40+ data-source integrations. Watch out for: its write-capable Operator Mode is newer than its read-only core.
K8sGPT. What it is: a CNCF Sandbox tool that scans a cluster and explains problems in plain English (GitHub). Best for: quick, free Kubernetes diagnosis. Watch out for: it scans and explains rather than running an open-ended investigation.
kagent. What it is: a CNCF Sandbox framework for running AI agents inside Kubernetes (GitHub). Best for: platform teams that want agents defined and run in-cluster. Watch out for: it is a framework, so you still design the agent.
OpenSRE. What it is: Tracer's open-source toolkit, which describes itself as a way to "build your own AI SRE agents" (Apache 2.0, GitHub). Best for: a head start with ready-made building blocks. Watch out for: a young project (its repository was created in January 2026), so expect its interfaces to keep changing.
NudgeBee. What it is: an AI SRE that NudgeBee describes as "the AI SRE that investigates like a senior engineer" (nudgebee.com), with four assistants (SRE, Kubernetes Ops, FinOps and CloudOps) on one backend, self-hosted or as Cloud SaaS. Best for: teams that want the whole system rather than building one, or that want to plug its context into their own agent through nbctl mcp as in Step 3b. Watch out for: a younger vendor than the incumbents, and the optional eBPF profiling agent needs privileged node access.
For a wider comparison, including commercial agents from Datadog, incident.io, PagerDuty and the hyperscalers, see the best AI SRE tools in 2026 and the 2026 agentic ops buyer's guide.
Frequently asked questions
What is an AI SRE agent?
An AI SRE agent is software that investigates production alerts the way an on-call engineer would. It reads the alert, queries Kubernetes, metrics and logs, forms and tests hypotheses, and returns a root cause with the evidence and a proposed fix. The safest agents are read-only and leave the decision to a human.
Which framework is best for building an AI SRE agent?
LangGraph, through LangChain's create_agent, handles tool-calling loops and structured output, and works with MCP through langchain-mcp-adapters. The OpenAI Agents SDK, the Claude Agent SDK and CrewAI are reasonable alternatives. The framework matters less than the tools, the prompt rules and the guardrails around it.
Do I need Temporal to build an AI agent?
No, but you need what it provides. An investigation calls several APIs that can fail and then waits for a human, possibly for hours. Temporal retries failed steps, keeps state through crashes and makes the approval wait reliable. Without it, you have to build retries, persistence and timeouts yourself.
Can an AI SRE agent fix production automatically?
It can, but it should not start that way. Google's SRE team runs its own agents through autonomy levels and only lets them act alone in well-bounded cases after measuring their success rate against human-verified data. Start at the level where the agent investigates and recommends and a person approves, and automate specific fixes only once you trust them.
How do I connect an AI agent to Kubernetes safely?
Use an MCP server such as kubernetes-mcp-server with read_only set to true, and run it with a dedicated service account bound to Kubernetes' built-in view role. That way the agent can inspect pods, events and logs but cannot change or delete anything, even if the model makes a mistake.
Are there open-source AI SRE agents I can start from?
Yes. HolmesGPT, K8sGPT and kagent are CNCF Sandbox projects under Apache 2.0, and OpenSRE is an Apache 2.0 toolkit for building your own AI SRE agents. HolmesGPT is the closest to a ready-made investigation agent, while kagent and OpenSRE are better starting points if you want to build.